Umbria Profitability Reports
Umbria Profitability comes with built-in reports that allow you to view profitability statistics and easily compare figures for multiple offices, departments, and individual timekeepers. The Reports are accessed on the Profitability module >Reports.
- Profit Statement shows gross income and expenses as well as profit and profit percentage.
- P&L Statement shows gross income and expenses as well as profit and profit percentage before allocation of expenses.
- Working Timekeeper Report shows additional information for each entity such as billed vs. collected revenue, realization, and standard rate vs. actual rate performance statistics.
- Commission Statement provides a summary of all matters associated with the role of originating lawyer/responsible lawyer and the hours, margin, fees collected by the timekeepers working on the matters.
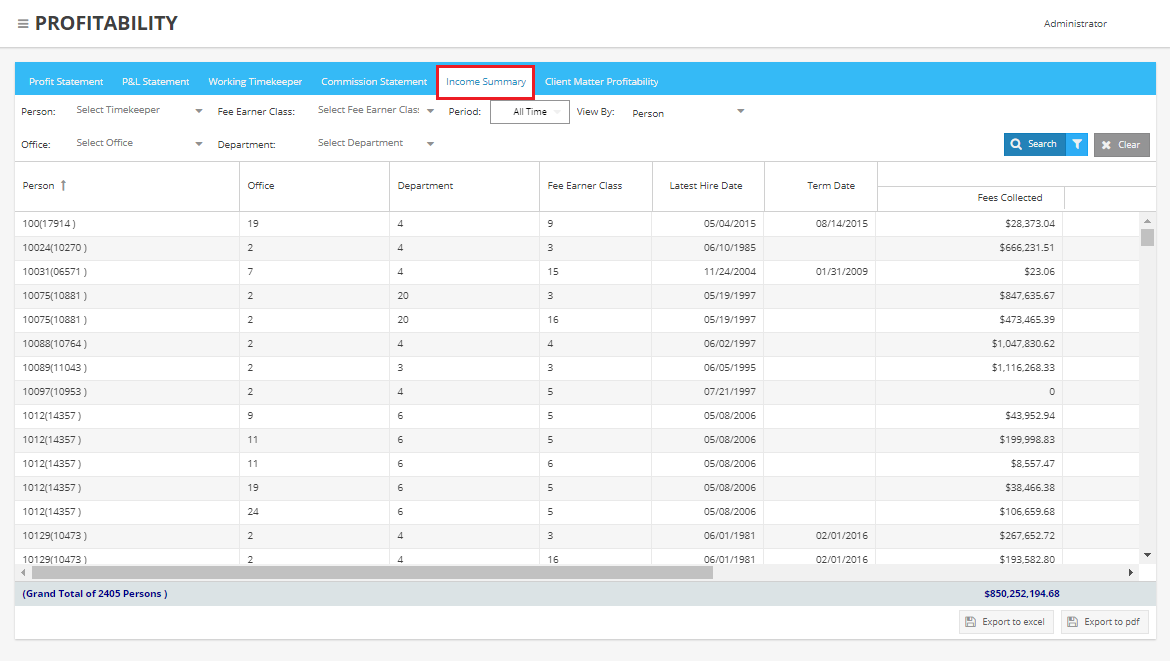
- Income Summary shows a summary of income and expenses for Office, Person and Department and the Net Income to the Firm.
- Client Matter Profitability Report displays the profitability by a client and/or matter.
Setting Report Parameters for Profit Statement, P&L Statement, and Working Timekeeper Report
After making the desired selections, click Search to retrieve report results.
- From the Report By drop-down, choose Firm, Office, Department, Person, Client, or Matter. You can then select each office, department, person, client, or matter you wish to report on from the drop-down to the right. You can choose to report on just one entity, or to report on multiple entities for a side-by-side comparison.
- To determine the time period you are reporting on, make a selection from the Period drop-down. Several standard time period options are available, and you can also select Custom Period and choose your own Start Date and End Date
Profit Statement
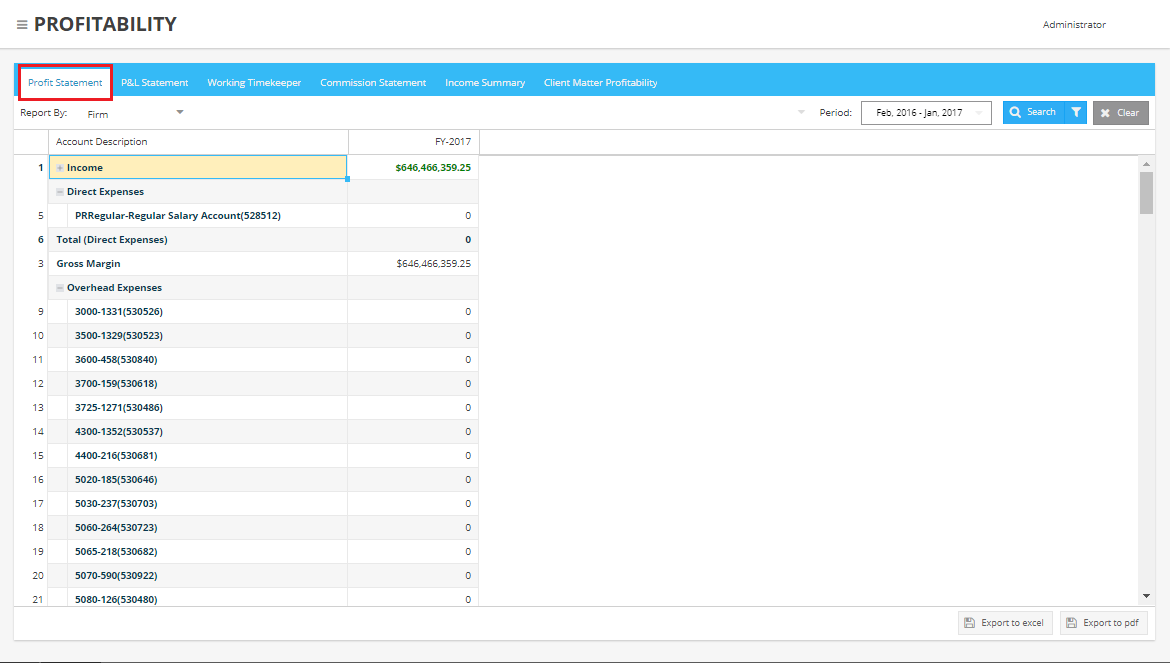
The Profit Statement report is generated from allocated income and expense transactions. The report is generated from the RevenueSummary and theExpenseSummary tables.
- RevenueSummary: This table is populated from the accounting database. This table contains a revenue summary by timekeeper and matters. Each timekeeper’s worked hours/amount, billed hours/amount, collected amount is stored in this table
- ExpenseSummary: This table is populated by the allocation engine. This table contains a summarized expense transaction.
The Profit Statement report consists of the following sections.
If comparing multiple timekeepers, departments, clients, matters, or offices, a separate column displays for each entity, with a Total column at the far right.
| Section | Description |
|---|---|
| Income |
Expand the Income header row to see a row for Revenue accumulated during the time period . You can click the plus sign to expand the Revenue drop down to see the fee earner/title/office/department/period and revenue amount. |
| Direct Expenses |
Expand the Direct Expenses header row to see a separate row for each General Ledger account that accumulated direct expenses during the time period and based on the parameters specified. You can click the plus sign to expand a General Ledger account and see a separate row for each affected sub-account. For example, you could expand the row for Payroll to see how much was spent on salary vs. benefits. |
| Total (Direct Expenses) |
The total direct expenses for all general ledger accounts from the salary file.
|
| Gross Margin | Income minus Direct Expenses |
| Overhead Expenses |
Expand the Overhead Expenses header row to see a separate row for each General Ledger account that accumulated overhead expenses during the time period and based on the parameters specified. You can click the plus sign to expand a General Ledger account and see a separate row for each affected sub-account. For example, you could expand the row for Travel to see how much was spent on airfare vs. car rental. |
| Net Margin/Gross Profit | Gross Margin minus Overhead Expenses |
| Profit (%) | (Net Margin / Total Income) * 100 |
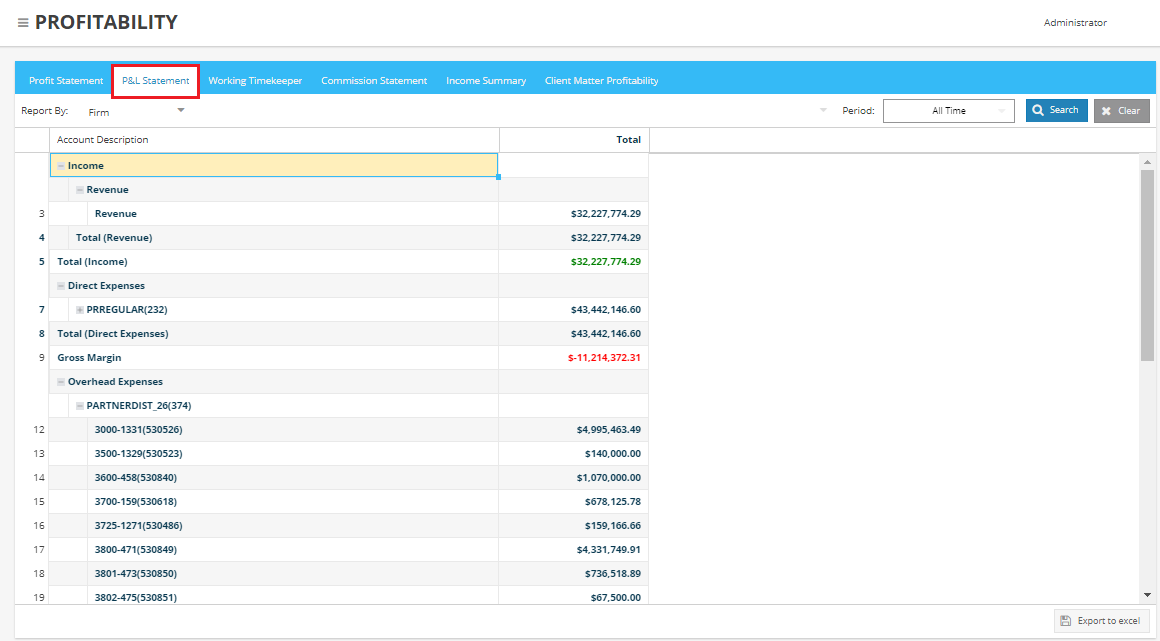
The P&L Statement Report is generated from income and expense table, before allocation of expenses. The report is generated from the GL.incomestatementand populateincomestatement tables.
The P&L Statement report consists of the following sections.
If comparing multiple timekeepers, departments, clients, matters, or offices, a separate column displays for each entity, with a Total column at the far right.
| Section | Description |
|---|---|
| Income |
Expand the Income header row to see a separate row for each General Ledger account that accumulated income during the time period and based on the parameters specified. You can click the plus sign to expand a General Ledger account and see a separate row for each affected sub-account. For example, you could expand the row for Collected Revenue to see how much was collected from each individual client. |
| Direct Expenses |
Expand the Direct Expenses header row to see a separate row for each General Ledger account that accumulated direct expenses during the time period and based on the parameters specified. You can click the plus sign to expand a General Ledger account and see a separate row for each affected sub-account. For example, you could expand the row for Payroll to see how much was spent on salary vs. benefits. |
| Total (Direct Expenses) | The total direct expenses for all general ledger accounts from the previous section. |
| Gross Margin | Income minus Direct Expenses |
| Overhead Expenses |
Expand the Overhead Expenses header row to see a separate row for each General Ledger account that accumulated overhead expenses during the time period and based on the parameters specified. You can click the plus sign to expand a General Ledger account and see a separate row for each affected sub-account. For example, you could expand the row for Travel to see how much was spent on airfare vs. car rental. |
| Net Margin/Gross Profit | Gross Margin minus Overhead Expenses |
| Profit (%) | (Net Margin / Total Income) * 100 |
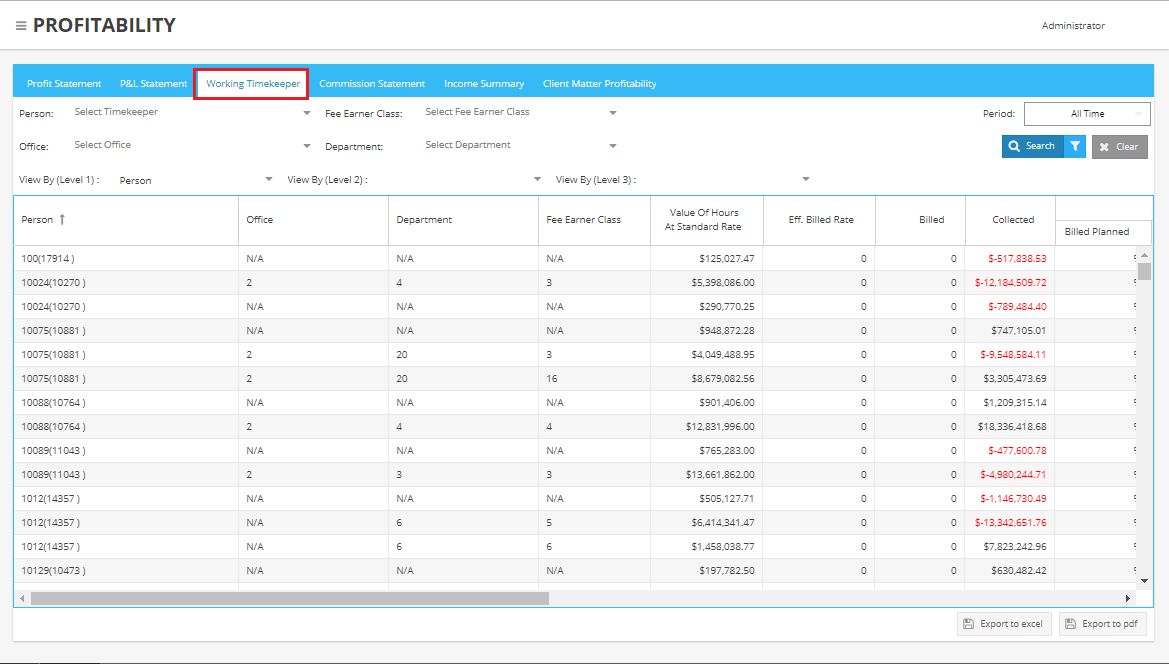
The Working Timekeeper Report consists of the following columns. Hover over any column and click the drop-down arrow to sort by that column, or select Columns to determine what columns you would like to display in the report output.
If comparing multiple timekeepers, departments, clients, matters, or offices, a separate row displays for each entity.
| Column | Description |
|---|---|
| Person/Office/Department |
Name of the person, office, or department for which this information applies. |
| Hours |
|
| Leverage |
|
| Value of Hours at Standard Rate | Number of hours worked multiplied by the firm standard rate for this fee earner class. |
| Eff. Billed Rate | Total amount billed / number of hours billed. |
| Billed | Total amount billed. |
| Collected | Total payments collected from the customer. |
| Realization |
|
| Standard Hours Basis |
|
| Actual Hours Basis |
|
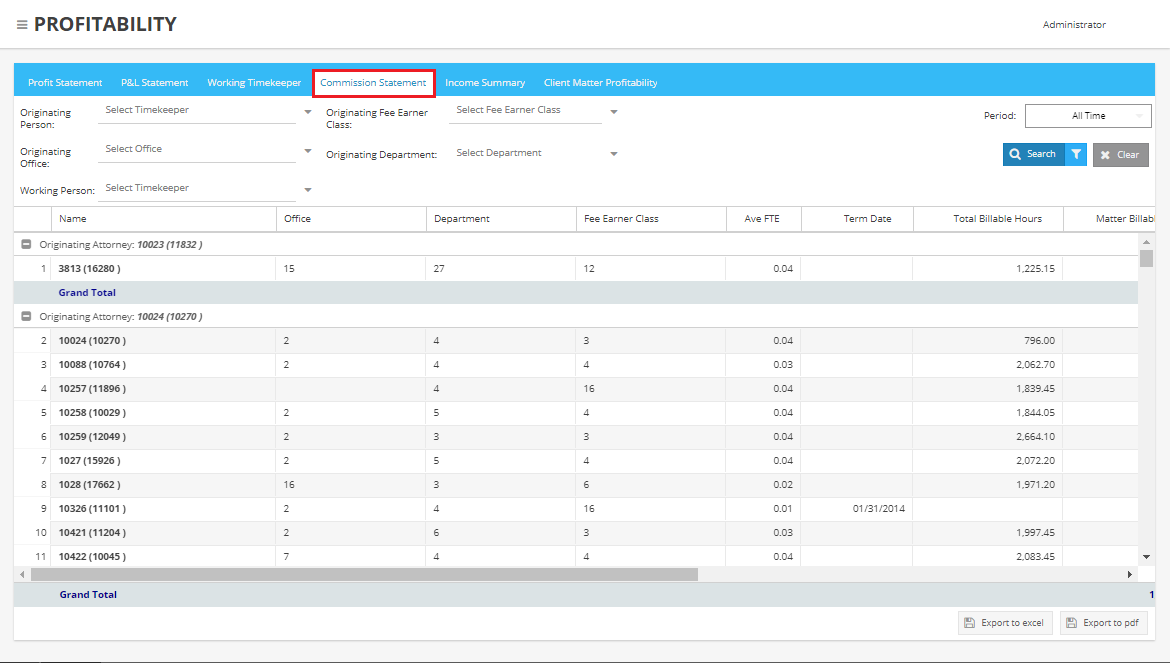
Setting Report Parameters for Commission Statement
After making the desired selections, click Search to retrieve report results.
- From the Select Time Keeper drop-down, choose the role of the originating attorney associated with the matters you wish to report on. Select the timekeeper(s) who worked on the matter you wish to report on from the drop-down to the right.
- To determine the time period you are reporting on, make a selection from the Period drop-down. Several standard time period options are available, and you can also select Custom Period and choose your own Start Date and End Date
The Commission Statement displays a report by the originating attorney. This report pulls all matters where a selected timekeeper is the originating attorney, then finds all timekeepers who worked on these matters, and then displays the report by timekeepers. This report is produced from the Revenuesummary, Timemonth and HourlyCostMonth tables
| Column | Description |
|---|---|
| Avg FTE | Average of FTE status of a person for a given period. This is read from the FeeEarnerDetailedBymonth table. |
| Total Billable Hours | The total billable hours by a person. This is pulled from the timemonth table. These are total worked hours by a person in a given period. |
| Allocation % | The ratio of Matter Billable Hours / Total Billable Hours. |
| Allocated Compensation | The hourly direct cost rate of a person in the relevant month multiplied by the number of billable hours. Hourly Direct Cost rate is calculated as Monthly Direct Cost / Total Worked Hours or total target hours (depending on configuration). |
| Allocated Overhead | The hourly overhead cost rate of a person in the relevant month multiplied by the number of billable hours. Hourly overhead Cost rate is calculated as Monthly Direct Cost / Total Worked Hours or total target hours (depending on configuration). |
| Net To Firm | Total Collected Amount – Total Cost (Allocated Overhead + Allocated Compensation). |
After making the desired selections, click Search to retrieve report results.
- You can select each office, department, person, client, or matter you wish to report on from the drop-down to the right. You can choose to report on just one entity, or to report on multiple entities for a side-by-side comparison.
- To determine the time period you are reporting on, make a selection from the Period drop-down. Several standard time period options are available, and you can also select Custom Period and choose your own Start Date and End Date
- Click the filter icon on the Search button for Advance Options to select Allocation Version. Check / Uncheck the box for Include Firm Adjustment in Overhead to include or exclude Firm Management point adjustments for expense calculations.
| Column | Description |
|---|---|
| Person/Office/Department |
Name of the person, office, or department for which this information applies. You can filter it in ascending or descending order |
| Fees Collected | Total fees collected by working timekeeper |
| Salary | Total salary paid to the working timekeeper |
| Overhead | Total overhead costs charged to the working timekeeper |
| Net to Firm | Fees Collected minus (Salary + Overhead) |
| Originating Fees Receipt | Original estimated fees to be collected |
| Grand Total | Total expenses under each category |
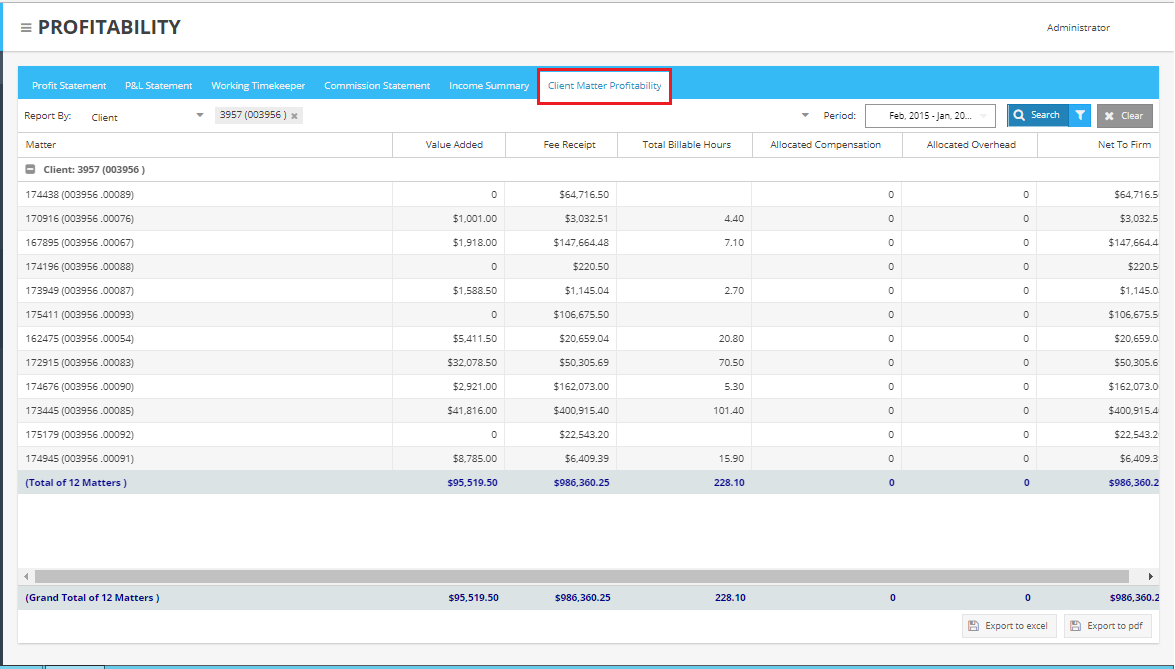
Setting Report Parameters for Client Matter Profitability Report:
After making the desired selections, click Search to retrieve report results.
- From the Report By drop-down, choose Client, Client Family
- Select the Matter from the Matter drop-down
- To determine the time period you are reporting on, make a selection from the Period drop-down. Several standard time period options are available, and you can also select Custom Period and choose your own Start Date and End Date
The Client Matter Report displays the profitability by a client and/or matter. For each selected client, all matters for the client are displayed with the following information:
| Column | Description |
|---|---|
| Worked Amount | Value of worked hours at agreed matter rate. |
| Fee Receipts | The total collected amount for a given matter. |
| Total Billable Hours | The total worked hours for a matter. This is pulled from the timemonth table. These are total worked hours by a person in a given period. |
| Allocated Compensation | The hourly direct cost rate of a person in the relevant month multiplied by the number of billable hours. The Hourly Direct Cost rate is calculated as Monthly Direct Cost / Total Worked Hours or total target hours ( depending on configuration). |
| Allocated Overhead | The hourly overhead cost rate of a person in the relevant month multiplied by the number of billable hours. The Hourly Overhead Cost rate is calculated as Monthly Direct Cost / Total Worked Hours or total target hours (depending on configuration). |
| Net To Firm | Total Collected Amount – Total Cost (Allocated Overhead + Allocated Compensation). |